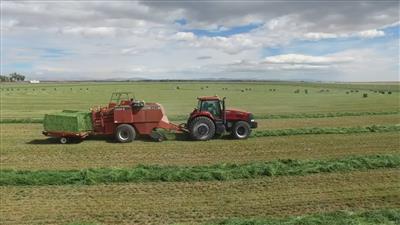
Hay is the 3rd largest U.S. crop in terms of harvest acres. It also provides environmental services, notably erosion control. Understanding the U.S. hay market is therefore important for both market and policy reasons. This article written by Ohio State University's Carl Zulauf examines the U.S. hay market since 1919, or when the U.S. Department of Agriculture, National Agricultural Statistical Service began to report data separately for alfalfa hay.
Production
Harvested tons of all hay trended higher during most of the 20th Century, but lower during the 21st Century (see Figure 1). Tons of alfalfa increased from the late 1930s until the mid-1980s, but has declined since. In contrast, tons of non-alfalfa trended erratically lower from 1919 until the early 1960s, but erratically higher since.
Harvest Acres
All hay acres peaked at 78 million in 1944 (see Figure 2). Declines have been particularly large from 1955 through 1970 and post 2002. Alfalfa acres increased until 1957, reaching 30 million; then remained stable until the late 1970s. Since 1979, alfalfa acres have declined 37{c78344d3e29215303d5d40d52b11c16d78bfae3d066d03ae10a9b147abb03b47} while non-alfalfa acres have increased 12{c78344d3e29215303d5d40d52b11c16d78bfae3d066d03ae10a9b147abb03b47}, resulting in alfalfa’s share of all hay acres declining from 45{c78344d3e29215303d5d40d52b11c16d78bfae3d066d03ae10a9b147abb03b47} to 31{c78344d3e29215303d5d40d52b11c16d78bfae3d066d03ae10a9b147abb03b47}.
Yield
Yields of alfalfa and non-alfalfa hay both trended higher during periods that spanned only one-third of the last 100 years: from 1950 until the mid-1980s for alfalfa and from 1965 until the mid-1990s for non-alfalfa (see Figure 3). Yield of all hay increased prior to 1950 but this increase was due to hay acres shifting into higher yielding alfalfa (see Figures 2 and 3).
Analysis of Harvest Acres
To keep the analysis simple, harvest acres of all hay over time are examined as a function of the ratio of the price of all hay to corn and the ratio of the yield of all hay to corn. Price and yield are variables commonly expected to impact acres of a crop. A ratio to corn is used because most acres can be planted to alternative crops and because corn is often considered the core American field crop. Since the focus of this analysis is on longer term trends, values of the variables are averaged over 10 years to reduce the impact of a single year. The analysis is constrained to the period since 1973 due to the major changes in U.S. prices, markets, and policy that occurred in the early 1970s. Values of the 3 variables used in this analysis are presented in Figure 4.
A regression analysis finds the price and yield ratios are both significant at the 99{c78344d3e29215303d5d40d52b11c16d78bfae3d066d03ae10a9b147abb03b47} level of statistical confidence. As expected, both ratios have a positive coefficient (see Figure 5). Assuming everything else is constant, the higher is the yield of all hay relative to the yield of corn and the higher is the price of all hay relative to the price of corn, the more favorable is the situation to produce hay. Taken together, the 2 ratios explain 63{c78344d3e29215303d5d40d52b11c16d78bfae3d066d03ae10a9b147abb03b47} of annual variation in the 10-year average of all hay harvest acres.
Summary Observations
- Hay is the 3rd largest U.S. crop measured by harvest acre.
- However, hay acres are trending lower.
- A simple analysis suggests the stagnate yield of hay in the face of increasing yield of corn and the decline in the price of hay relative to the price of corn for much of the 21st Century (see Figure 4) are likely to be key factors behind the decline in hay acres.
- Environmental benefit of lower erosion on hay acres, combined with the role of yield in the acres of hay, illustrate the importance of research to improve the environmental performance of U.S. agriculture. Yet, the Conservation title of the farm bill has little if any spending directed toward research. Its lack of attention to research is worth consideration.
Data Source
U.S. Department of Agriculture, National Agricultural Statistics Service. August 19, 2018. QuickStats. http://quickstats.nass.usda.gov/
Source: Drovers


