On September 18th, the USDA announced the second round of payments from the Coronavirus Food Assistance Program (CFAP) that would provide up to $14 billion in disaster relief . Eligible farmers and ranchers can start applying for those funds through December 11, 2020.
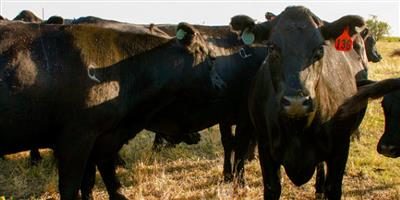
Most of the main commodities grown in Montana are eligible for this program, including beef cattle, bison, dairy cows, wheat, barley, sugar beets, sunflowers, dry peas, chickpeas, lentils, and many others. There are only a few commodities NOT eligible for this program and include some crops for animal grazing and breeding stock. Clearly, this list of eligible commodities is more extensive than the first CFAP, which only included commodities that experienced a more than 5% decline in commodity prices.
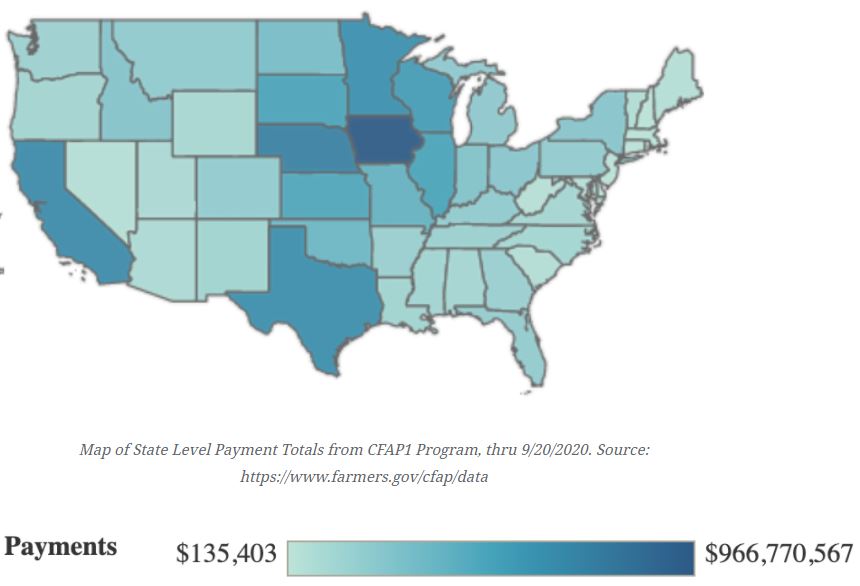
While we are now at the end of the first CFAP, we can look to see how these payments have flowed through Montana agriculture. One source of data for this is the CFAP Dashboard, which shows that nationally $10.1 billion in payments have been made through 638,476 claims. Of that total, the majority of payments have gone to beef cattle ($4.3b, 42.3%), corn ($1.8b, 17.4%), milk ($1.7b, 17.3%), and hogs ($0.6b, 5.9%). Below is a map of this nationally, showing the largest share of payments in the upper Midwest and central plains regions.
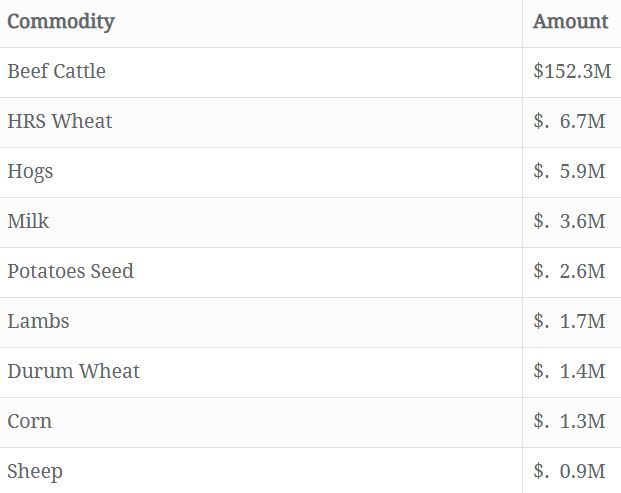
As of 9/20/2020, Montana has had 10,846 claims approved and received $180 million in payments (less than 2% of all payments nationally). Below is a list of the top commodities receipts from the CFAP in Montana.
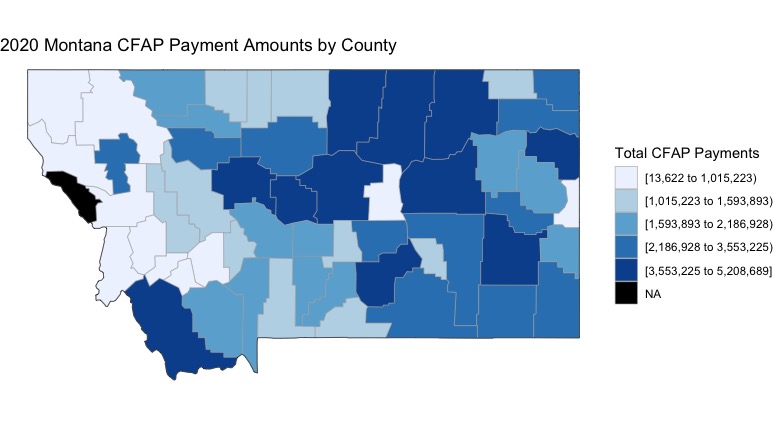
To get a better look into the distribution of CFAP payments to Montana farms and ranches, data were received from the Farm Service Agency (under a Freedom of Information Act). While I am awaiting final data that includes all payments under the entire CFAP program, I recently received data through July 27, 2020, which includes $115 M in payments for Montana (64% of the total). While these figures are not final, it does provide an opportunity to get an initial look at the county distribution of payments.
As seen in the figure below, the largest concentration of payments can be found in the central and eastern parts of the state, along with Beaverhead county in the southwestern region. These counties in dark blue reflect counties with substantial amount of beef cattle production.
Looking at the map below shows the average amount per claim by county and reflects larger payments going to counties that with larger cattle operations, including those in the southwest (Beaverhead and Deer Lodge counties), southeast (Custer, Powder River, Carter, and Prarie counties) and south central (Meagher, Wheatland, Golden Valley, Yellowstone, and Treasure counties) regions.
The average payment per farm in Montana was $16,562, which is slightly above the national average of $15,838 per farm. This slight increase in per farm payments within Montana should not be surprising given the relatively larger cattle operations in the state.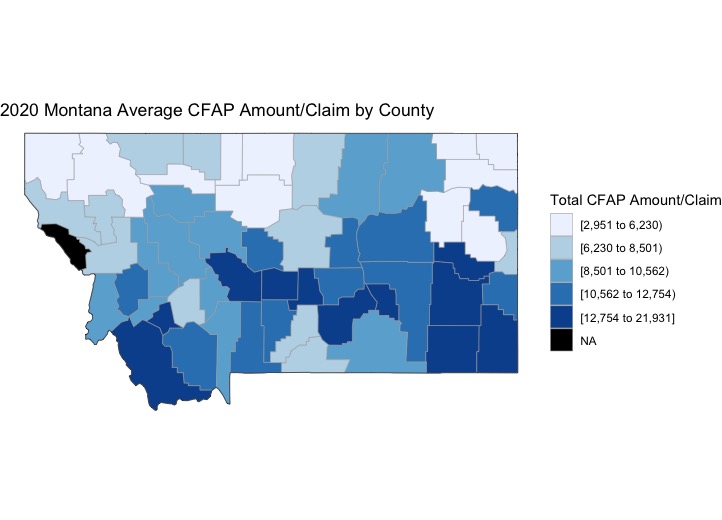
Eric Belasco – Associate Professor in the Department of Agricultural Economics and Economics at Montana State University. Find more at AgEconMT.com
