The March Cattle on Feed report showed February placements at 109.6 percent of one year ago. Placements were anticipated to be higher year over year, but the total was slightly above average pre-report expectations. February feedlot marketings were 103.4 percent of last year, close to expectations. February had an extra day due to leap year, which accounts for some of the February increases. Some of the increased February placements was also due to weather disruptions in January that delayed cattle movements. In fact, combined January and February placements were up just 0.6 percent year over year.
The March 1 feedlot inventory was 11.838 million head, up 1.3 percent compared to 2023. Feedlot inventories have been stubbornly slow to adjust down compared to cattle inventories generally. Table 1 shows that the U.S. calf crop since 2018, the largest calf crop in the last decade, has decreased by 7.5 percent to 2023. This is a total reduction in calf production of 2.72 million head in that six-year period. The 2024 calf crop is expected to be lower still with a smaller beef cow herd coming into this year. The calculated feeder supply on January 1, 2024 was the lowest in data available back to 1972.

However, feedlot inventories have remained relatively large despite declining cattle numbers. Table 1 shows that the total U.S. cattle on feed inventory on January 1, 2024 was actually higher than the total cattle on feed on January 1, 2019, following the peak calf crop. Feedlot inventories continued to climb until 2022. The January 1, 2024 feedlot inventory was down just 1.8 percent from the 2022 peak.
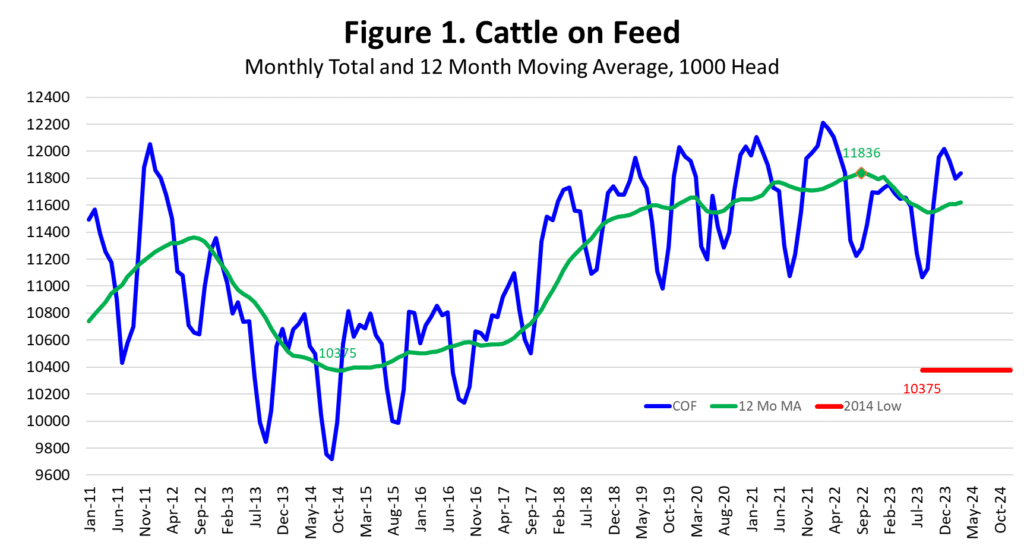
The monthly cattle on feed reports tell the same story. Average monthly feedlot inventories continued to climb until the September 2022 peak of 11.836 million head (Figure 1). The 12-month moving average of monthly feedlot inventories declined from October 2022 – October 2023 before increasing to the current level of 11.62 million head in March 2024, down 1.8 percent from the peak. Recent increases in feedlot inventories are due to short-run changes in timing of cattle, i.e. pulling cattle ahead, but are not sustainable given the smaller overall cattle supplies.

Figure 1 shows that average monthly feedlot inventories decreased to a low of 10.375 million head in 2014 as head rebuilding began. One of the primary reasons that feedlot inventories have remained as high thus far is due to the continued placement and feeding of heifers. At some point, increased heifer retention will lead to more pronounced decreases in feedlot inventories, perhaps to levels similar to the 2014 low. It’s not clear when that will happen as herd rebuilding appears to be progressing slowly and drought continues to be a threat to the size of the beef cow herd.
Other factors have contributed somewhat to maintaining feedlot inventories, especially additional days on feed and heavier finishing weights. The year over year increase in Mexican cattle imports in 2023 may be contributing somewhat to the current increase in feedlot inventories but do not explain the generally larger feedlot inventories in recent years. Total feeder cattle imports from Mexico and Canada have been down over the period.
On January 1, 2024, the total feedlot inventory represented a record of 16.5 percent of the All Cattle and Calves inventory in the country. However, decreased cattle numbers and herd rebuilding will inevitably lead to smaller feedlot inventories in the coming months.
###
Derrell Peel – Oklahoma State University Extension


